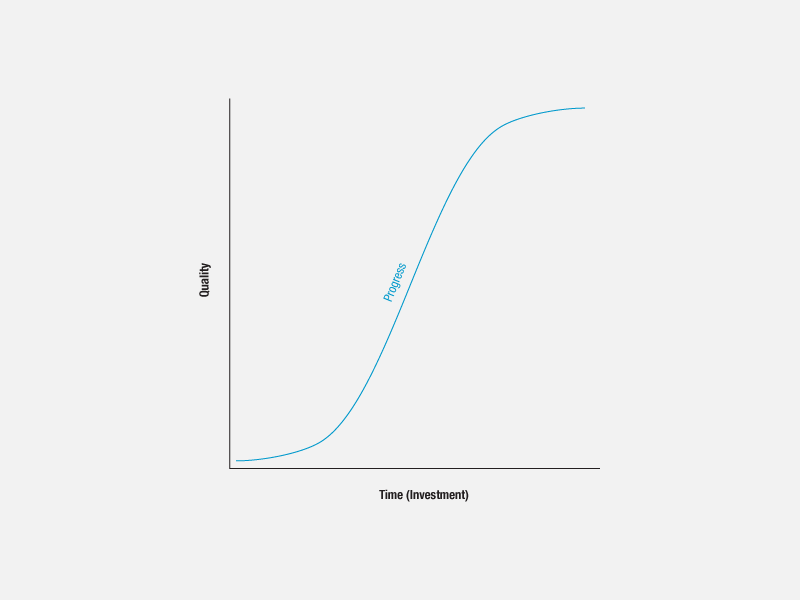
S-curves describe change over time, often units sold or projected to be sold.
Related Diagrams
[tag-gallery tag=s-curve columns=5 theight=100 twidth=150]
S-curves describe change over time, often units sold or projected to be sold.
[tag-gallery tag=s-curve columns=5 theight=100 twidth=150]