Jan 22, 2024
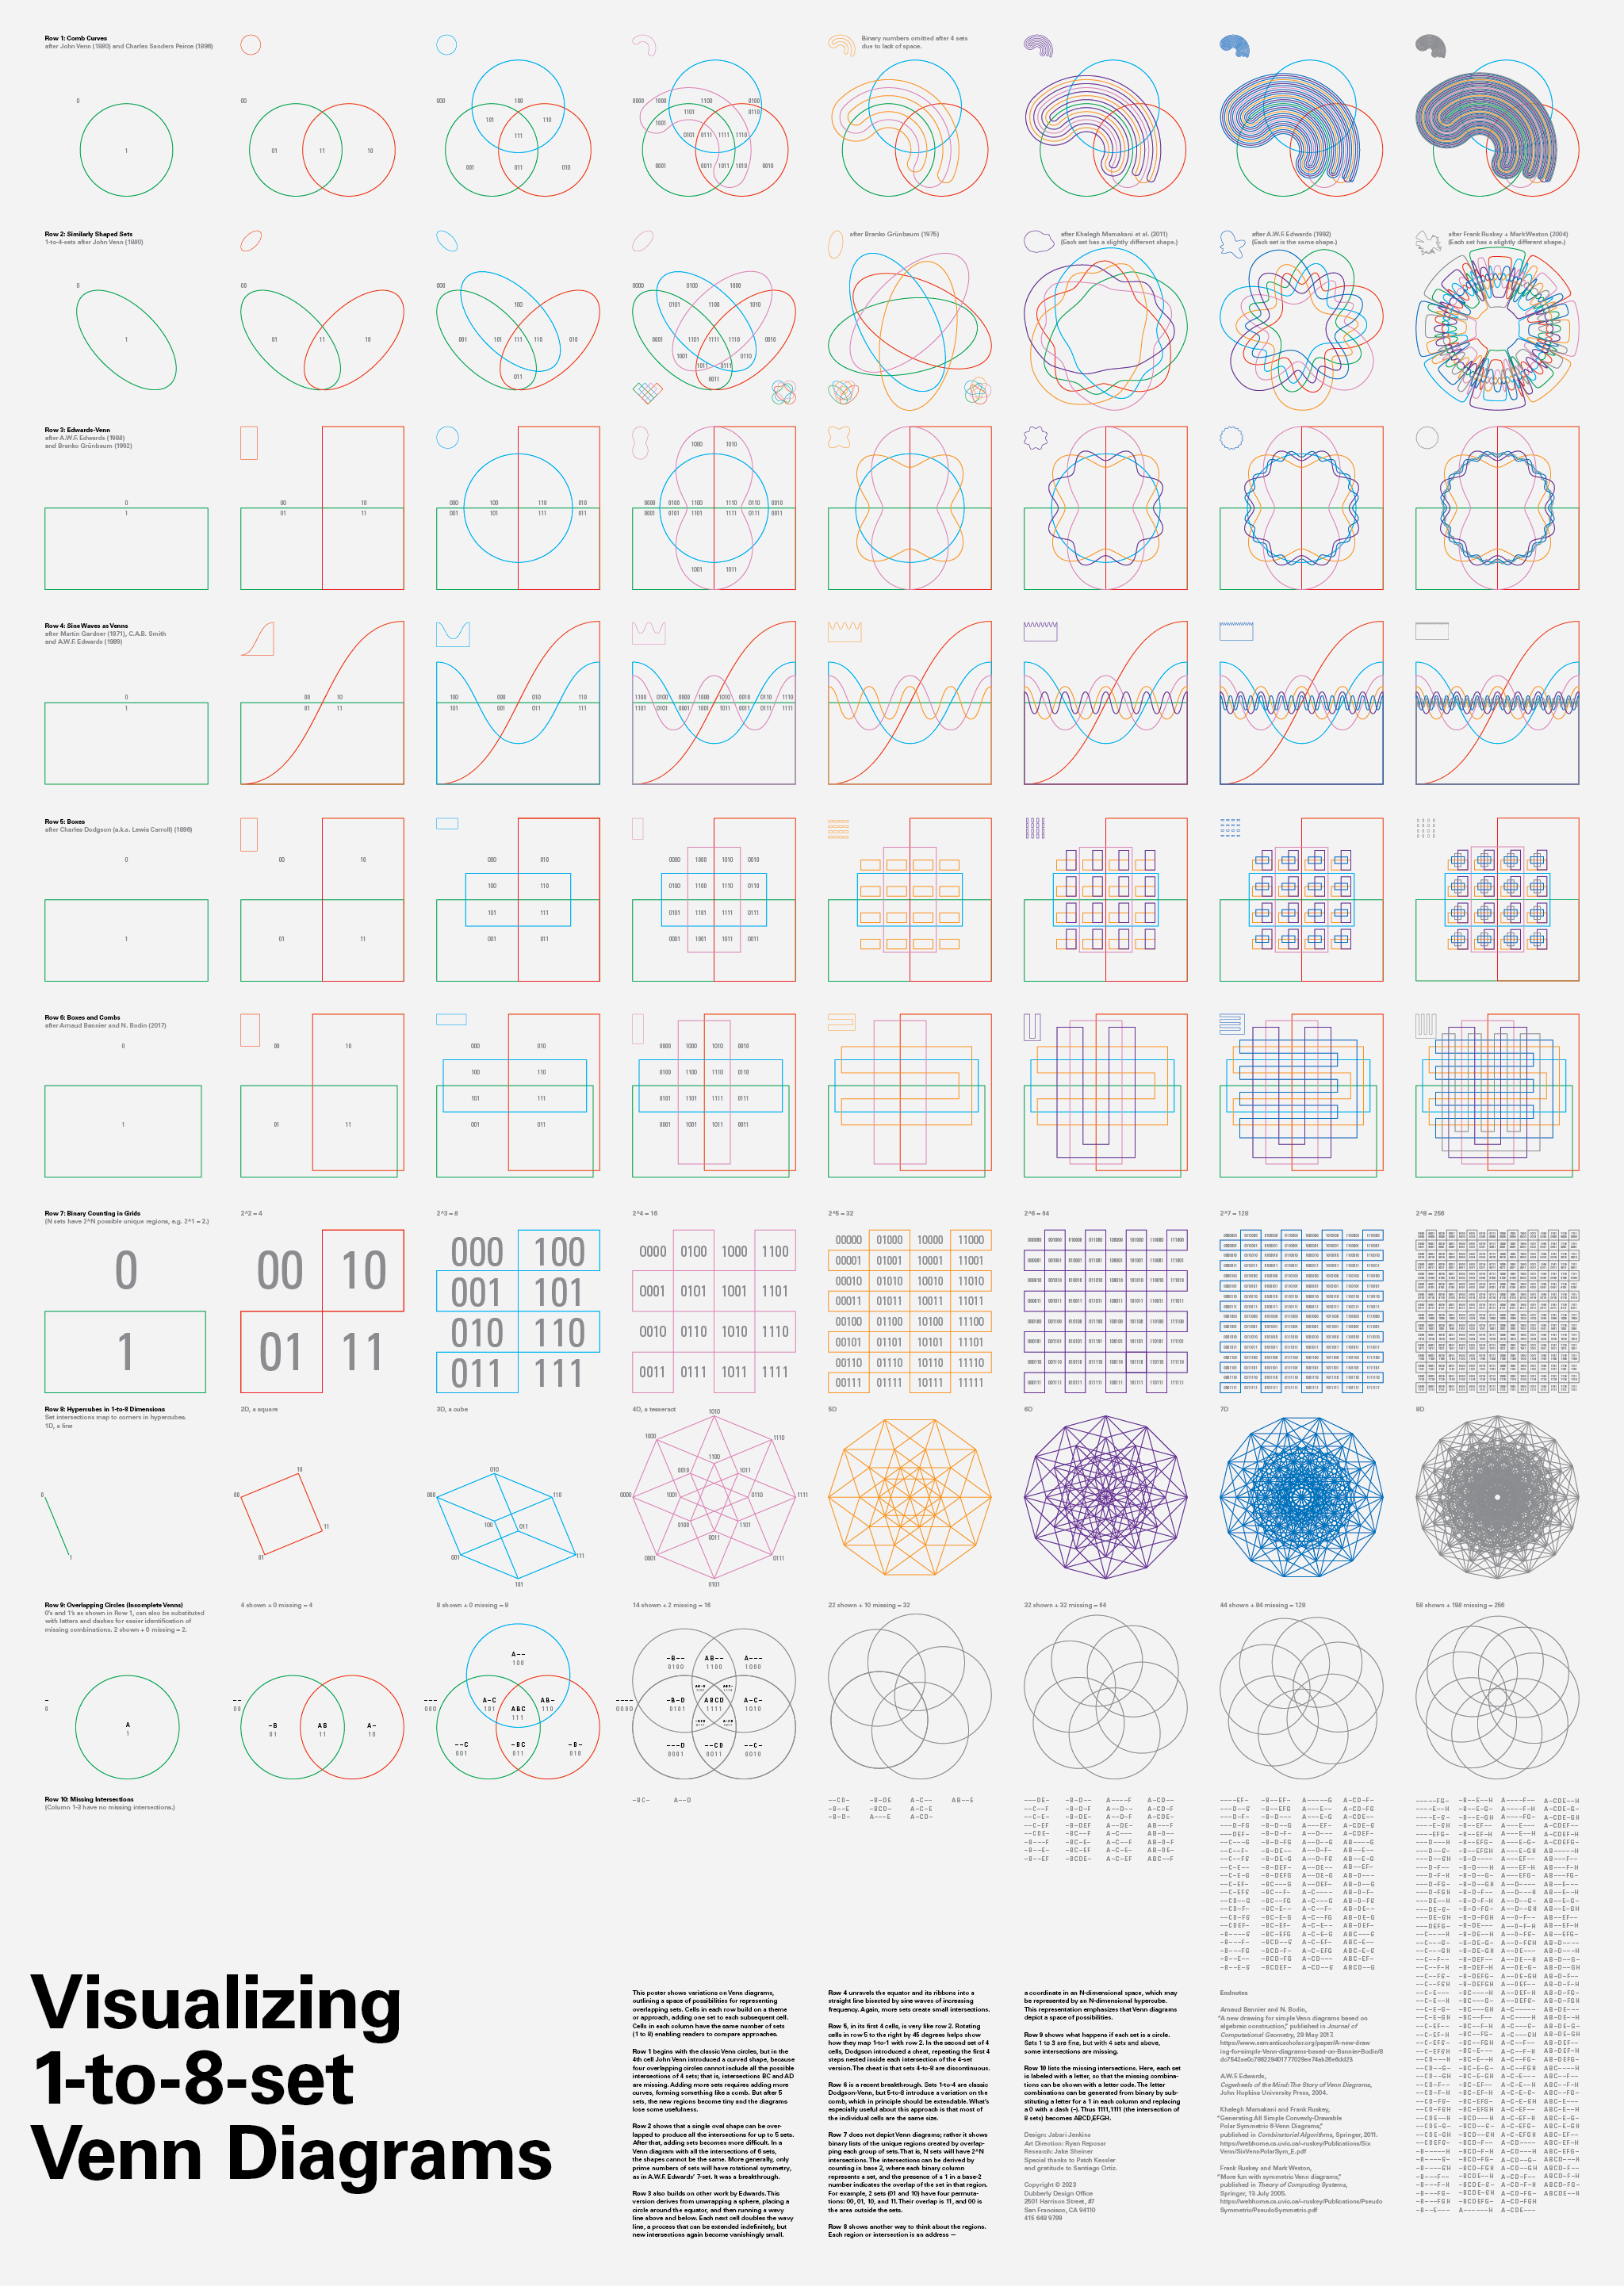
This poster shows variations on Venn diagrams, outlining a space of possibilities for representing overlapping sets. Cells in each row build on a theme or approach, adding one set to each subsequent cell. Cells in each column have the same number of sets (1 to 8) enabling readers to compare approaches.
Row 1 begins with the classic Venn circles, but in the 4th cell John Venn introduced a curved shape, because four overlapping circles cannot include all the possible intersections of 4 sets; that is, intersections BC and AD are missing. Adding more sets requires adding more curves, forming something like a comb. But after 5 sets, the new regions become tiny and the diagrams lose some usefulness.
Row 2 shows that a single oval shape can be overlapped to produce all the intersections for up to 5 sets. After that, adding sets becomes more difficult. In a Venn diagram with all the intersections of 6 sets, the shapes cannot be the same. More generally, only prime numbers of sets will have rotational symmetry, as in A.W.F. Edwards’ 7-set. It was a breakthrough.
Row 3 also builds on other work by Edwards.This version derives from unwrapping a sphere, placing a circle around the equator, and then running a wavy line above and below. Each next cell doubles the wavy line, a process that can be extended indefinitely, but new intersections again become vanishingly small.
Row 4 unravels the equator and its ribbons into a straight line bisected by sine waves of increasing frequency. Again, more sets create small intersections.
Row 5, in its first 4 cells, is very like row 2. Rotating cells in row 5 to the right by 45 degrees helps show how they map 1-to-1 with row 2. In the second set of 4 cells, Dodgson introduced a cheat, repeating the first 4 steps nested inside each intersection of the 4-set version.The cheat is that sets 4-to-8 are discontinuous.
Row 6 is a recent breakthrough. Sets 1-to-4 are classic Dodgson-Venn, but 5-to-8 introduce a variation on the comb, which in principle should be extendable. What’s especially useful about this approach is that most of the individual cells are the same size.
Row 7 does not depict Venn diagrams; rather it shows binary lists of the unique regions created by overlapping each group of sets. That is, N sets will have 2^N intersections. The intersections can be derived by counting in base 2, where each binary column represents a set, and the presence of a 1 in a base-2 number indicates the overlap of the set in that region. For example, 2 sets (01 and 10) have four permutations: 00, 01, 10, and 11. Their overlap is 11, and 00 is the area outside the sets.
Row 8 shows another way to think about the regions. Each region or intersection is an address — a coordinate in an N-dimensional space, which may be represented by an N-dimensional hypercube. This representation emphasizes that Venn diagrams depict a space of possibilities.
Row 9 shows what happens if each set is a circle. Sets 1 to 3 are fine, but with 4 sets and above, some intersections are missing.
Row 10 lists the missing intersections. Here, each set is labeled with a letter, so that the missing combinations can be shown with a letter code.The letter combinations can be generated from binary by substituting a letter for a 1 in each column and replacing a 0 with a dash (–). Thus 1111,1111 (the intersection of 8 sets) becomes ABCD,EFGH.
Endnotes
Arnaud Bannier and N. Bodin, “A new drawing for simple Venn diagrams based on algebraic construction,” published in Journal of Computational Geometry, 29 May 2017. https://www.semanticscholar.org/paper/A-new-drawing-for-simple-Venn-diagrams-based-on-Bannier-Bodin/8dc7542ae0c786229401777029ee74ab26e6dd23
A.W.F. Edwards, Cogwheels of the Mind: The Story of Venn Diagrams, John Hopkins University Press, 2004.
Khalegh Mamakani and Frank Ruskey, “Generating All Simple Convexly-Drawable Polar Symmetric 6-Venn Diagrams,” published in Combinatorial Algorithms, Springer, 2011. https://webhome.cs.uvic.ca/~ruskey/Publications/SixVenn/SixVennPolarSym_E.pdf
Frank Ruskey and Mark Weston, “More fun with symmetric Venn diagrams,” published in Theory of Computing Systems, Springer, 13 July 2005. https://webhome.cs.uvic.ca/~ruskey/Publications/Pseudo Symmetric/PseudoSymmetric.pdf