-
Dubberly Design Office
2501 Harrison Street, No. 7
San Francisco, CA 94110 -
415 648 9799 phone
415 648 9899 fax
Concept Maps
We create concept maps, a type of model,
to explore and learn about complex information spaces.
By showing everything—the forest and the trees—in a single view,
concept maps help people create mental models and clarify thoughts.
We create concept maps to share understanding—
with our clients, peers, and others interested in the subjects.
Please note: many of our concept maps are poster size.
They can be printed at smaller sizes (11 x 17), but may be difficult to read.
A few of the maps have been printed and are available through our office.
Feb 10, 2026
The space of shapes between square, circle, and square
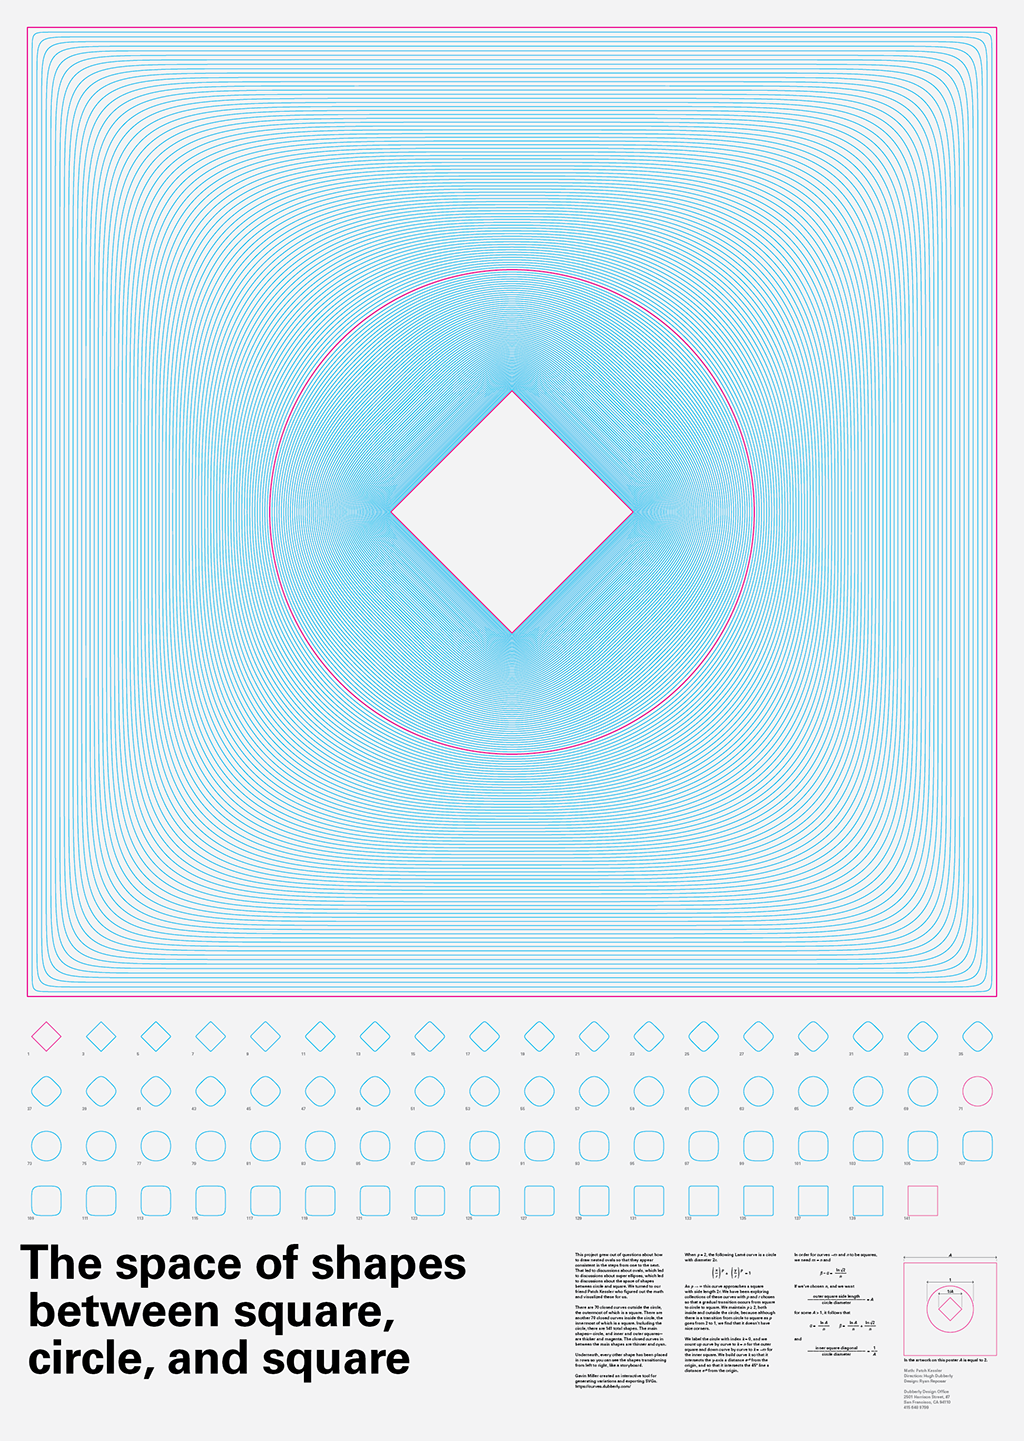
This project grew out of questions about how to draw nested ovals so that they appear consistent in the steps from one to the next. That led to discussions about ovals, which led to discussions about super ellipses, which led to discussions about the space of shapes between circle and square. We turned to our friend Patch Kessler who figured out the math and visualized these for us.
More…Feb 26, 2024
Jan 22, 2024
Visualizing 1-to-8-set Venn Diagrams
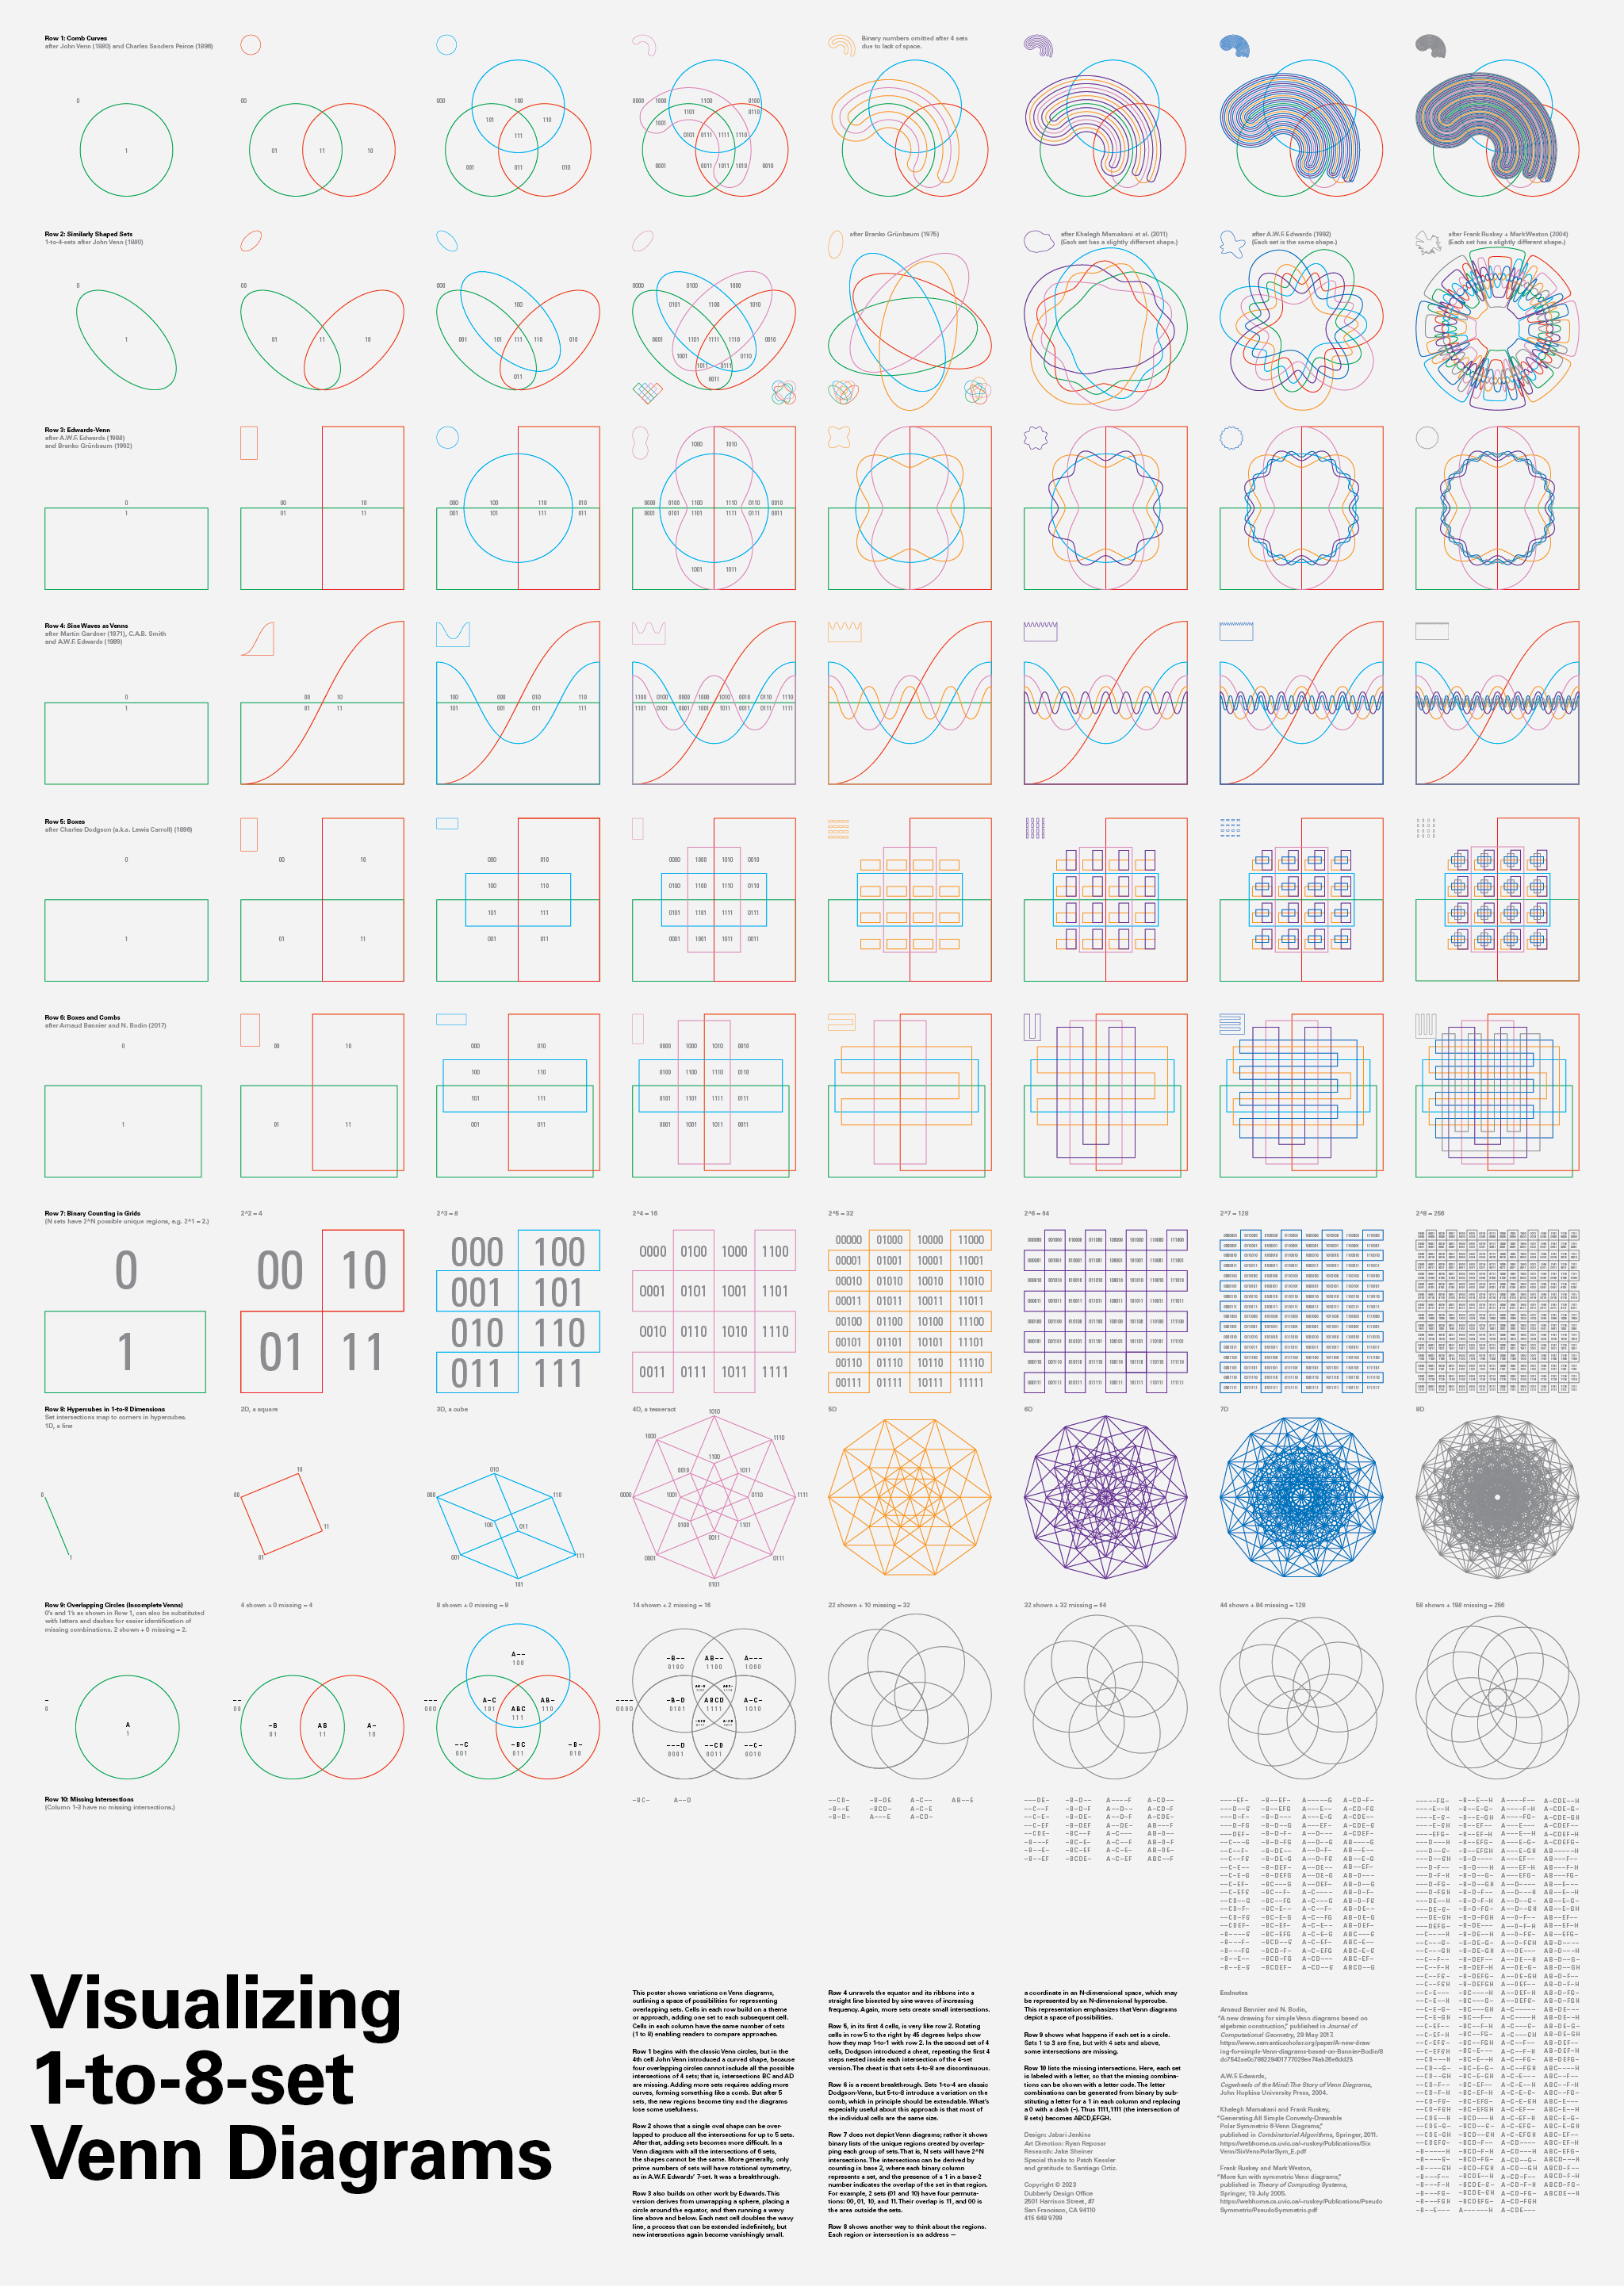
This poster shows variations on Venn diagrams, outlining a space of possibilities for representing overlapping sets. Cells in each row build on a theme or approach, adding one set to each subsequent cell. Cells in each column have the same number of sets (1 to 8) enabling readers to compare approaches.
More…Jul 3, 2019
The tic-tac-toe solution space
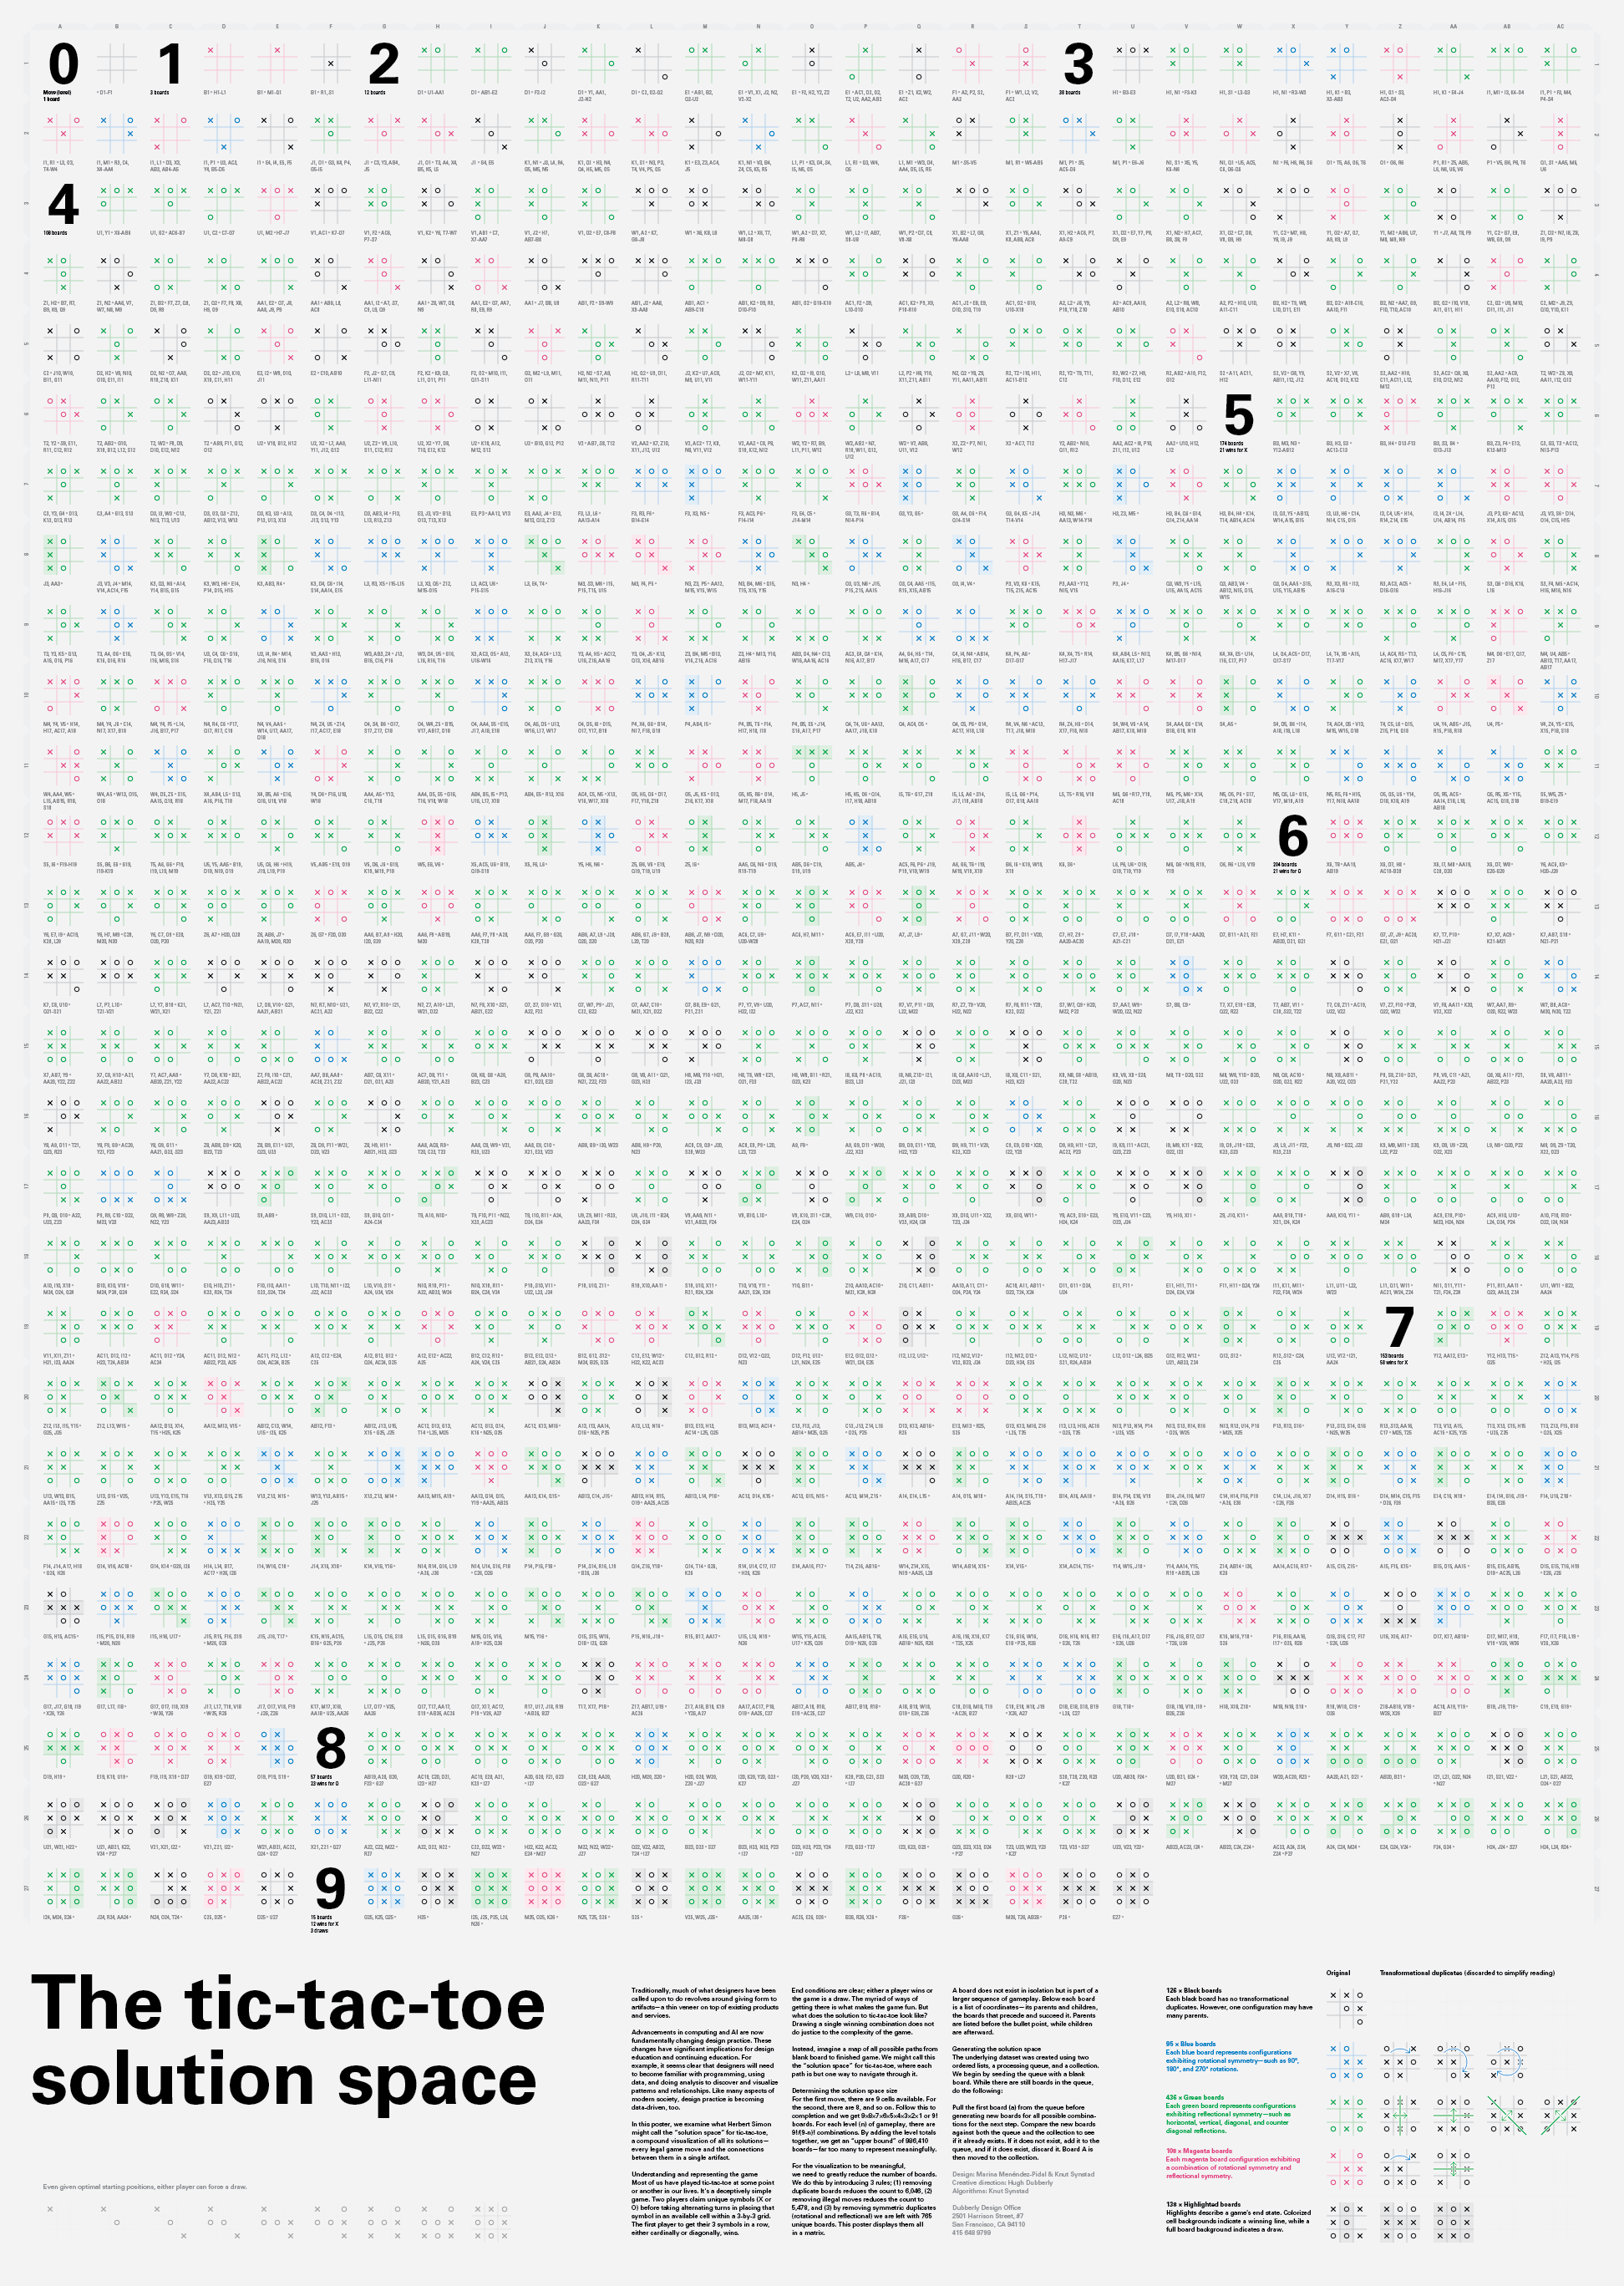
Traditionally, much of what designers have been called upon to do revolves around giving form to artifacts—a thin veneer on top of existing products and services.
Advancements in computing and AI are now fundamentally changing design practice. These changes have significant implications for design education and continuing education. For example, it seems clear that designers will need to become familiar with programming, using data, and doing analysis to discover and visualize patterns and relationships. Like many aspects of modern society, design practice is becoming data-driven, too.
More…Mar 30, 2016
Measuring corn production
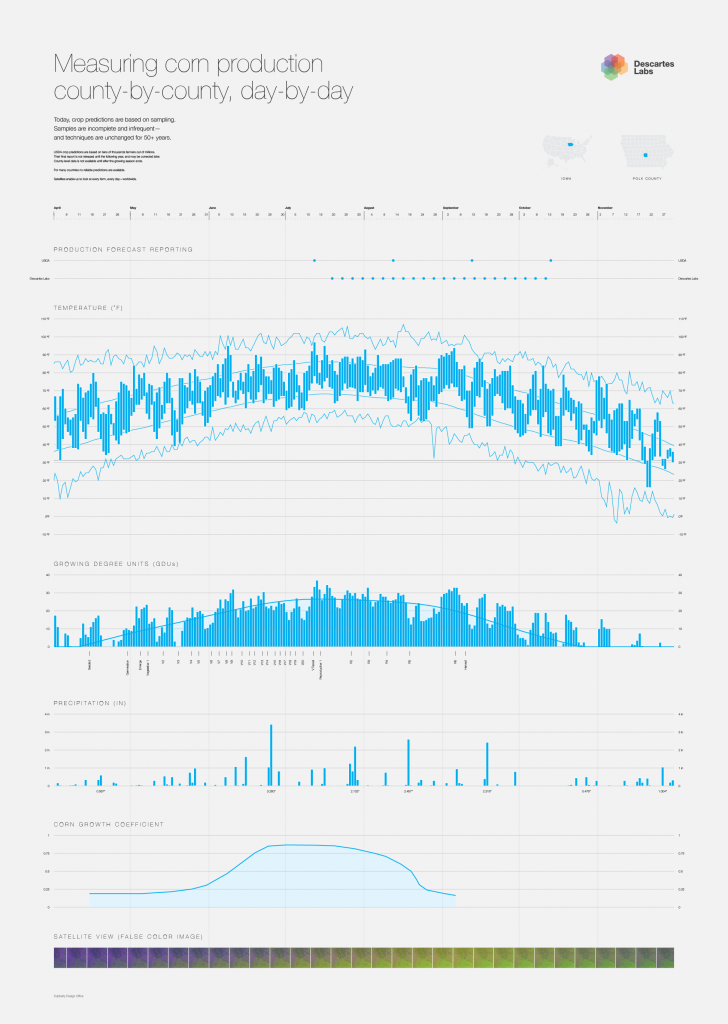
Today, crop predictions are based on sampling. Samples are incomplete and infrequent—and techniques are unchanged for 50+ years.
More…Feb 4, 2016
Bruce Archer’s Design Process Checklist
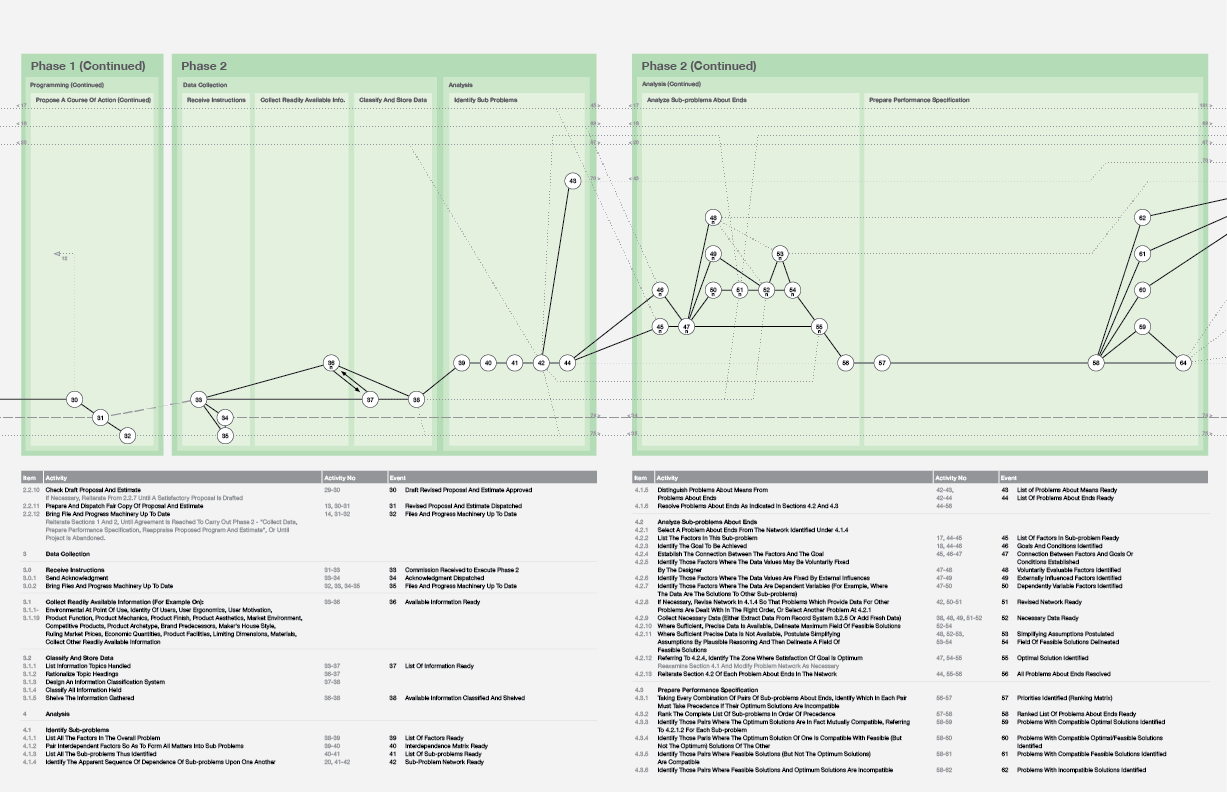
The image above is only a small slice (2 of 15 pages) of the overall model.
This is a re-drawing of Bruce Archer’s 229-step design process; which is difficult to come by. It also brings together Archer’s descriptive text with the diagram for the first time.
Sep 2, 2014
TrustTheVote Election Technology Framework
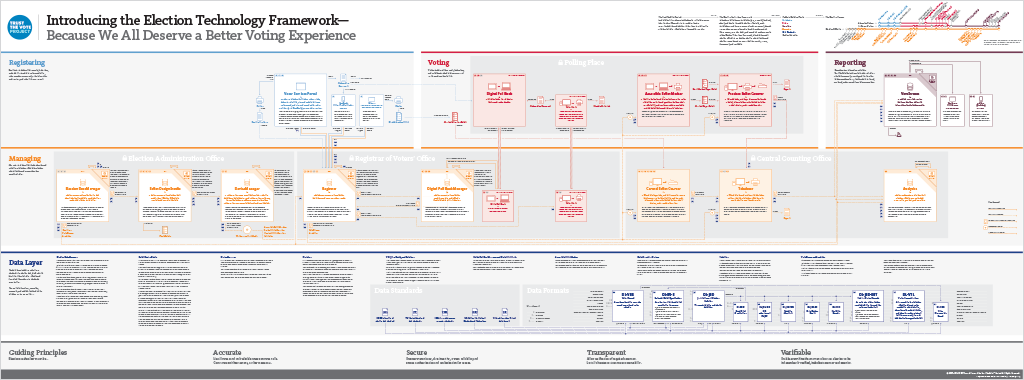
We’ve been working directly with the Open Source Election Technology Foundation (OSET) on the TrustTheVote Project — an open source project to reimagine the voting system in the United States. The TrustTheVote Election Technology Framework is something new — a blueprint for developing a complete elections system.
Jul 17, 2014
Chicago Design Museum Poster
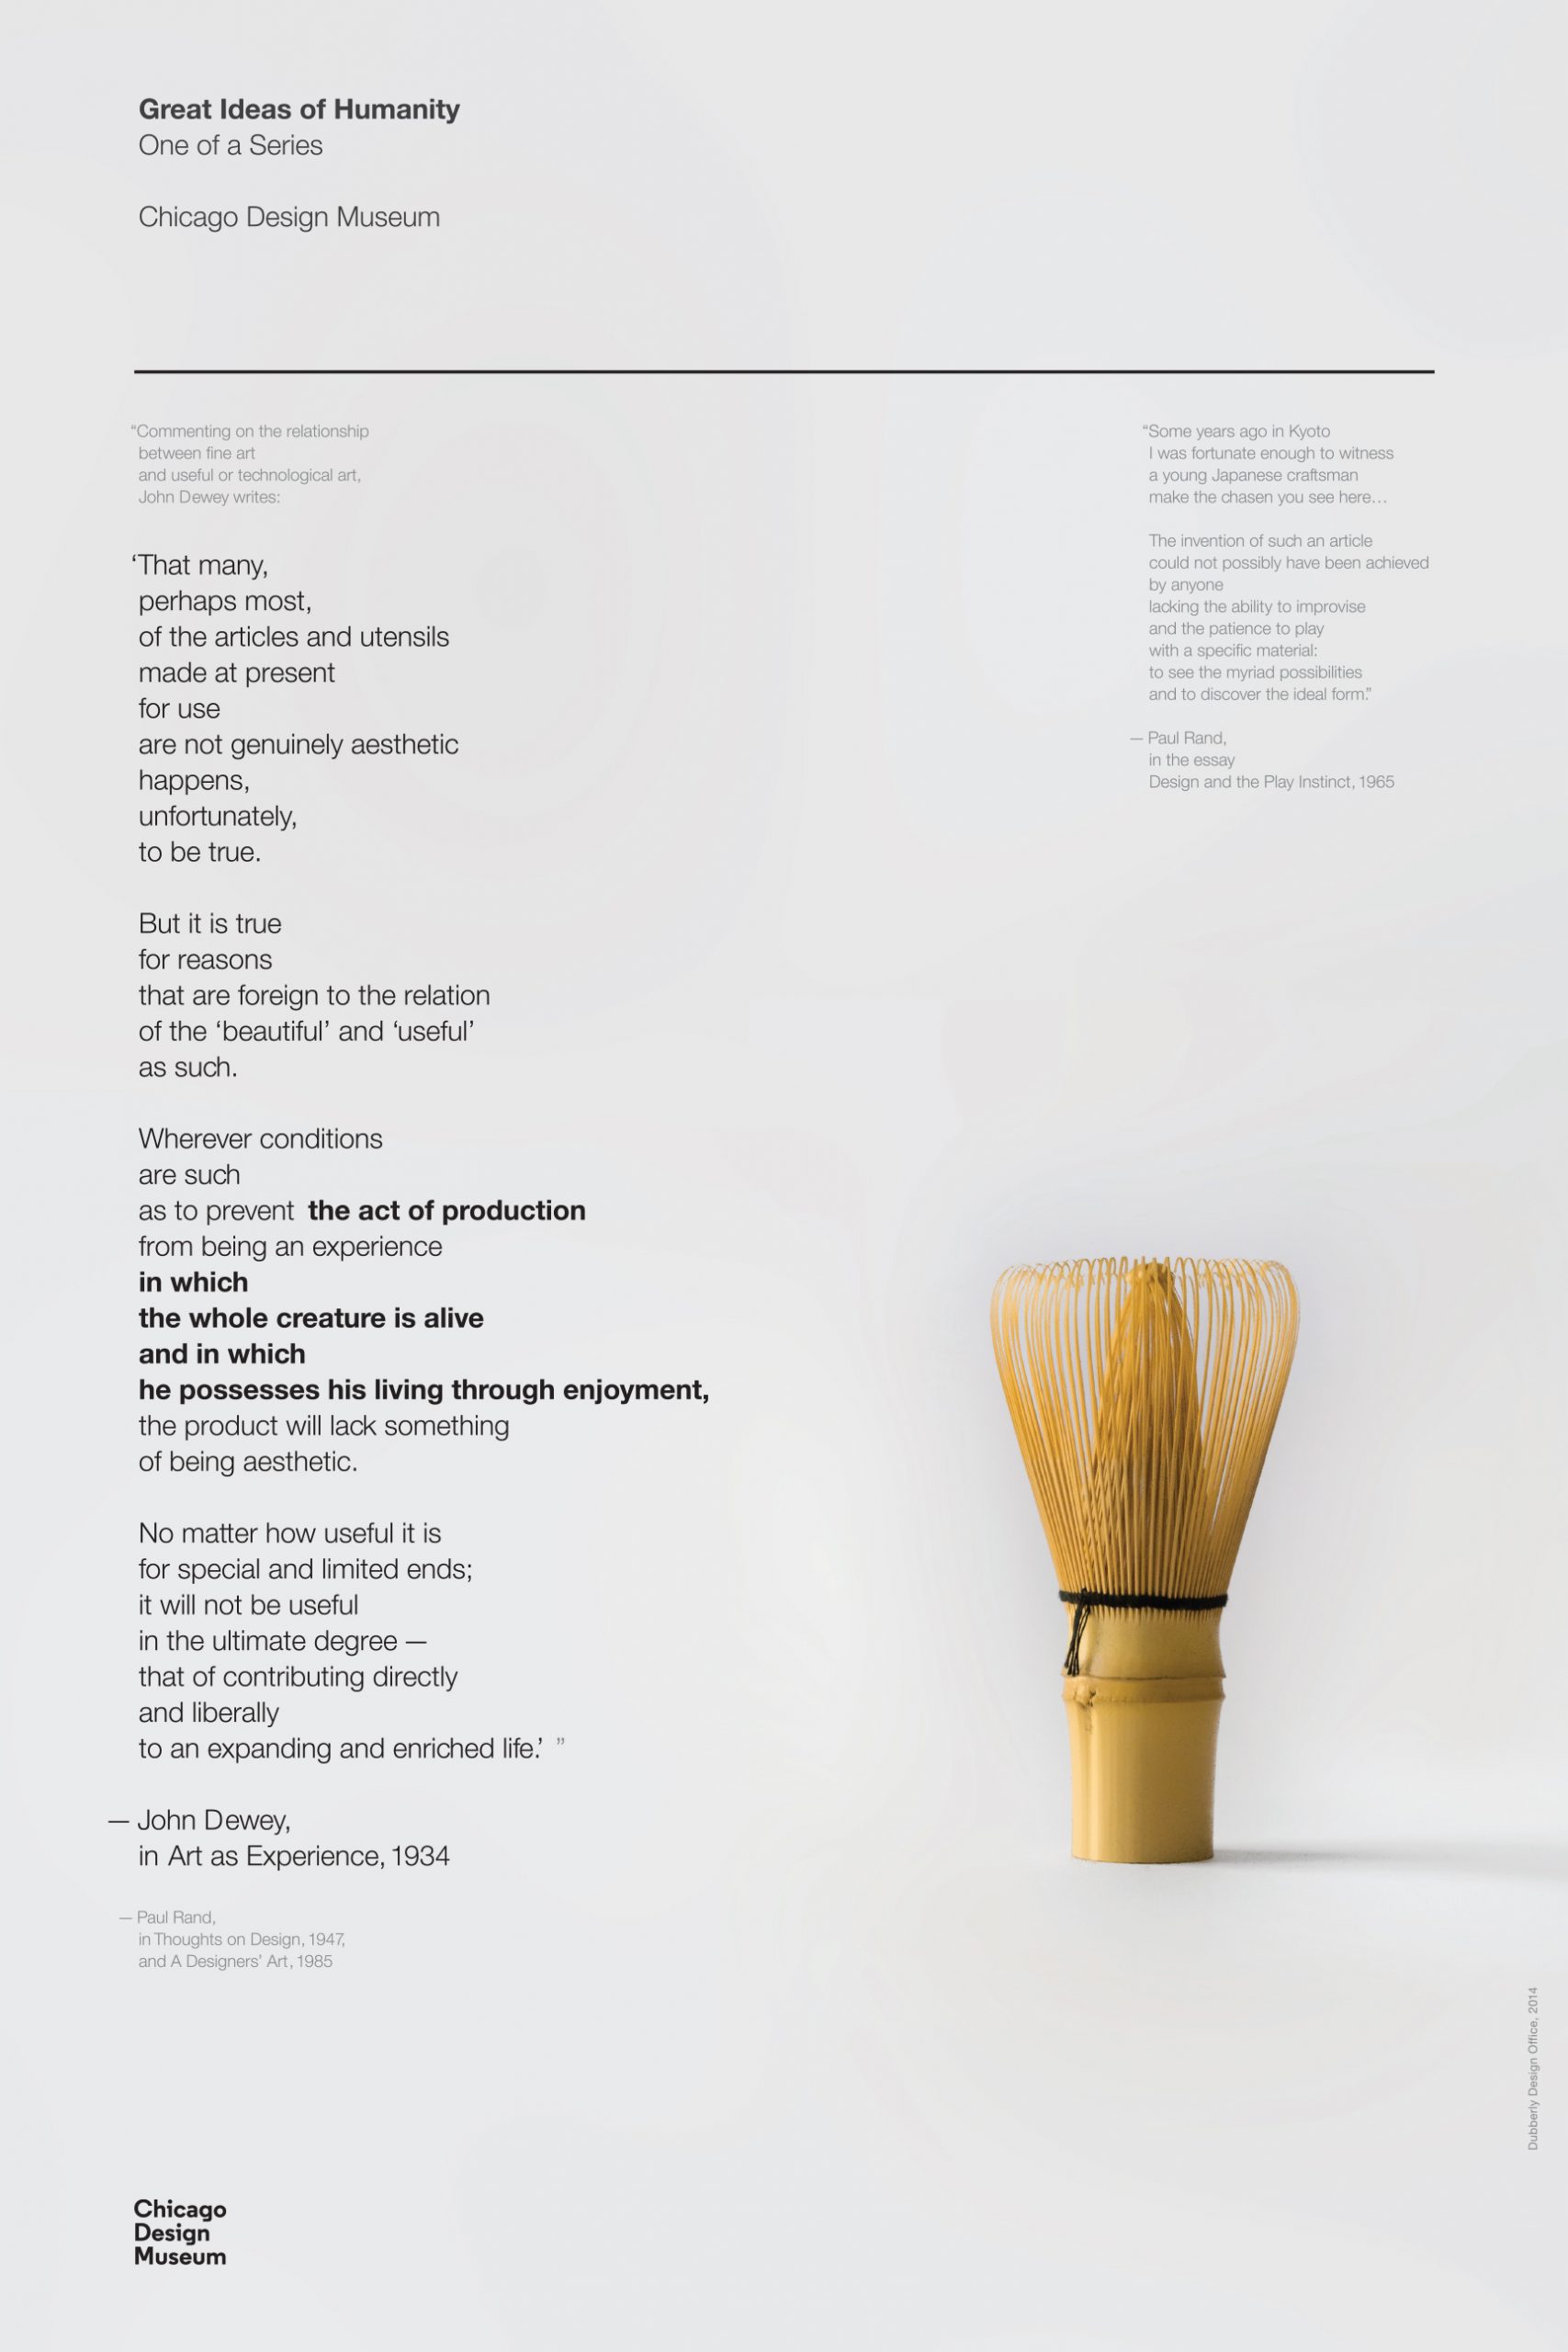
In 2014, the Chicago Design Museum asked us to contribute a poster to their reboot of the great ideas of humanity series, originally championed by Container Corporation of America.
More…Mar 25, 2013
Computer Networks
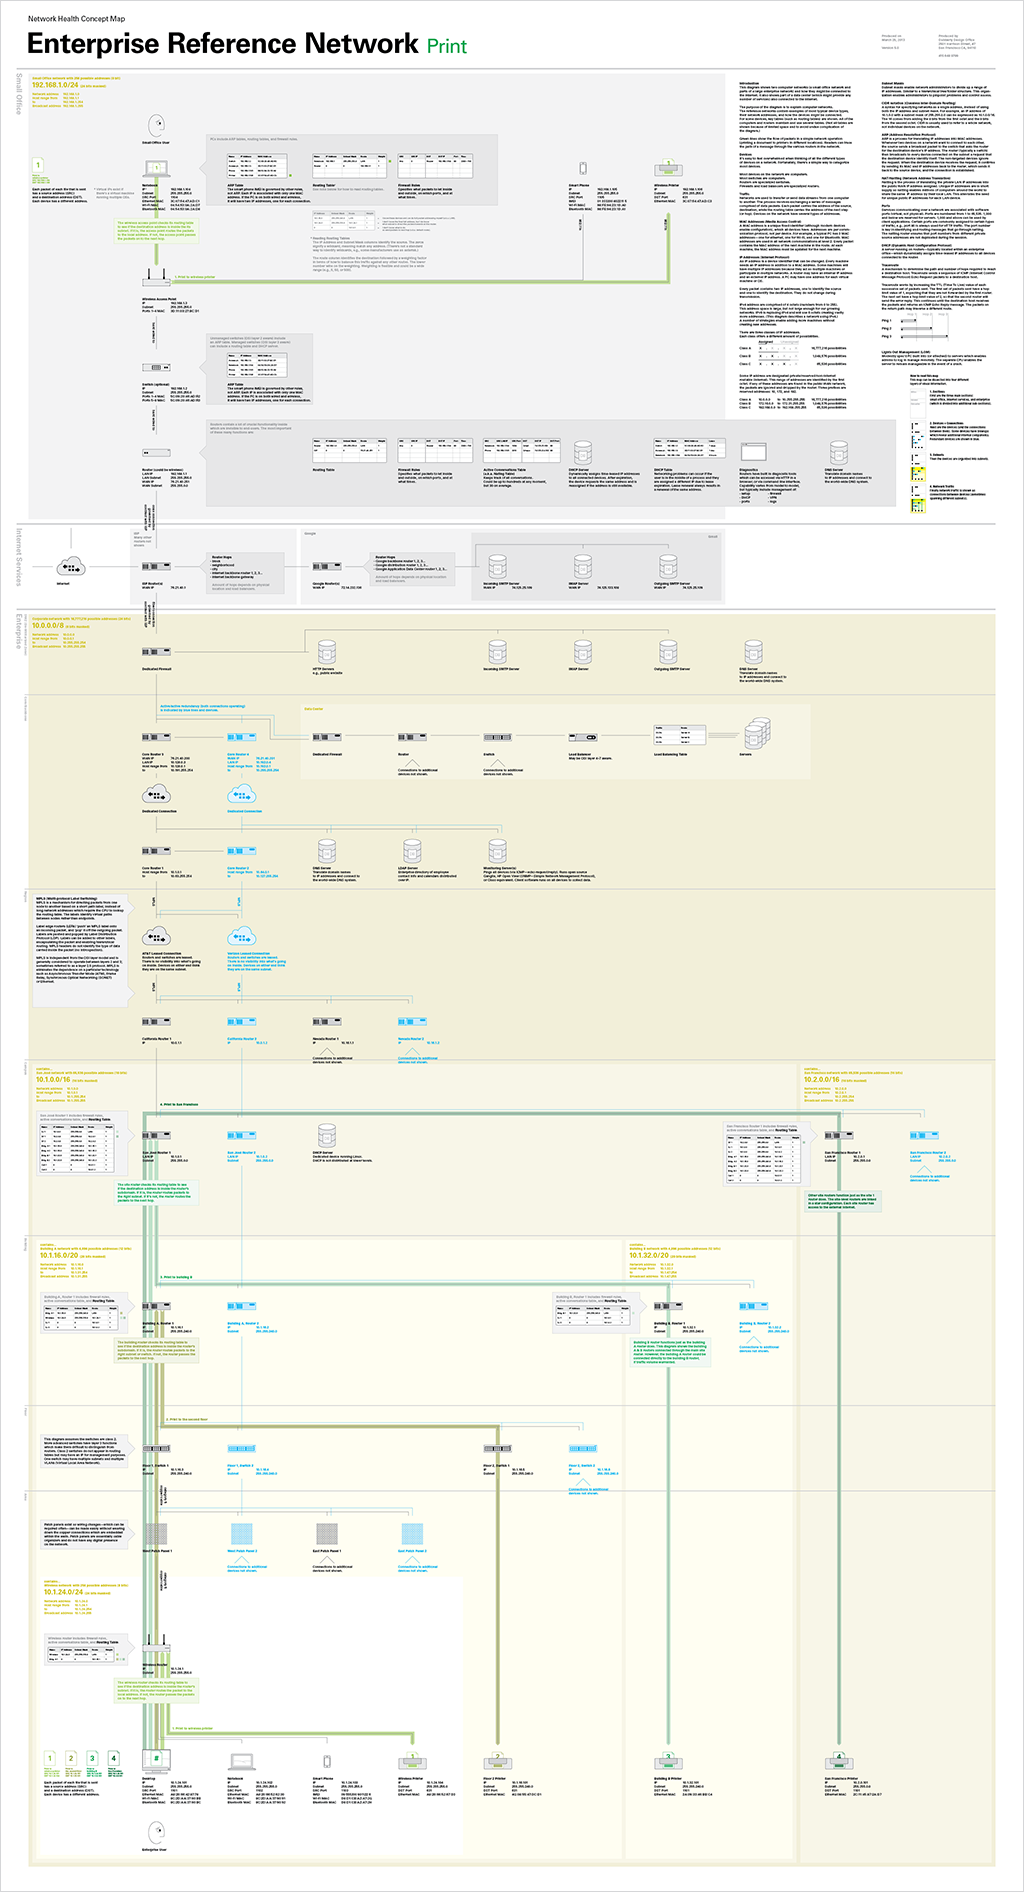
We created these diagrams to help us better understand computer networks.
The diagrams use two computer networks—a small office network and sections of a large enterprise network—as reference networks.
Sep 28, 2011
Alzheimer’s Disease

This diagram presents a model of Alzheimer’s disease. It brings together many facts about Alzheimer’s disease to present a picture of the disease and the context in which it operates.
The diagram is intended to help people who are familiar with some aspects of AD have a wider understanding of it. It is also helpful for people who might be learning about Alzheimer’s for the first time.